House Prices
I’ve put together my own affordability index - since 1976 - that is similar to the FirstAm approach (more of a house price index adjusted by mortgage rates and the median household income).

08 September 2021 · Issue #925 · View online
The measures I typically use to compare house prices over time are 1) real house prices (nominal house prices adjusted for inflation), 2) a Price-to-rent ratio, and 3) House prices to median income.
Another measure that is commonly used is an “affordability index”. These indexes calculate affordability based on income and mortgage rates.
I’ll present two commonly referenced affordability indexes, and then present my own calculations and some comments on the usefulness of these indexes.
Housing: A Look at “Affordability” Indexes
CalculatedRisk by Bill McBride:
NAR Affordability Index
The National Association of REALTORS® (NAR) releases several affordability indexes. Here is the most recent blog post by NAR Research Data Specialist Michael Hyman on the monthly index:
Housing Affordability Weakens in June as Home Prices Ascend
At the national level, housing affordability declined in June compared to a year ago according to NAR’s Housing Affordability Index. Affordability declined in June compared to one year ago as the median family incomes rose by 2.3%, while the monthly mortgage payment increased 21.5%. The effective 30-year fixed mortgage rate1 was 3.03% this June compared to 3.22% one year ago, but the median existing-home sales price rose 24.4% from one year ago.

The higher the number in this index, the more affordable a house. Here is the NAR explanation:To interpret the indices, a value of 100 means that a family with the median income has exactly enough income to qualify for a mortgage on a median-priced home.
An index above 100 signifies that family earning the median income has more than enough income to qualify for a mortgage loan on a median-priced home, assuming a 20 percent down payment.
For example, a composite HAI of 120.0 means a family earning the median family income has 120% of the income necessary to qualify for a conventional loan covering 80 percent of a median-priced existing single-family home. An increase in the HAI, then, shows that this family is more able to afford the median priced home.
The calculation assumes a down payment of 20 percent of the home price and it assumes a qualifying ratio of 25 percent. That means the monthly P&I payment cannot exceed 25 percent of the median family monthly income.
First American Real House Price Index
IMPORTANT: Although “Real” is in the title of the index, this is NOT inflation adjusted.
Another type of index measures house prices based on affordability. Here is a tweet from FirstAm Deputy Chief Economist Odeta Kushi.
Nominal house price growth hits another record in June - 19% YoY. According to our RHPI, nominal house prices are well above the housing boom peak, but real, house-buying power-adjusted house prices remain 42% below the housing boom peak. https://t.co/NFQjRCm2ll pic.twitter.com/zoPwN8yjsj
— Odeta Kushi (@odetakushi) August 31, 2021
She is referencing a blog post by FirstAm Chief Economist Mark Fleming: Today’s House Prices Are Over 40 Percent More Affordable Than The Housing Boom Peak
The Real House Price Index (RHPI) measures affordability in the context of changes in consumer house-buying power, incorporating fluctuations in household income, mortgage rates and nominal house prices.
In June, housing affordability declined on a year-over-year basis for the fourth month in a row, following two years of increasing affordability. The decline in June occurred even as two of the three key drivers of the RHPI, household income and mortgage rates, swung in favor of greater affordability relative to one year ago.
Here is a description from FirstAm: The First American Real House Price Index (RHPI) measures the price changes of single-family properties throughout the U.S. adjusted for the impact of income and interest rate changes on consumer house-buying power over time and across the United States at the national, state and metropolitan area level. Because the RHPI adjusts for house-buying power, it is also a measure of housing affordability.
Calculated Risk Affordability Index
I’ve put together my own affordability index - since 1976 - that is similar to the FirstAm approach (more of a house price index adjusted by mortgage rates and the median household income).
I used median income from the Census Bureau (estimated 2020 and 2021), assumed a 15% down payment, and used a 2% estimate for property taxes, insurance and maintenance. This is probably low for high property tax states like New Jersey and Texas, and too high for lower property tax states. If we were including condos, we’d also include HOA fees too (this is excluded).
Update: For house prices, I used the Case-Shiller National Index, Seasonally Adjusted (SA). Also, for the down payment - there wasn’t a significant difference between 15% and 20%.For mortgage rates, I used the Freddie Mac PMMS (30 year fixed rates).
Here is a graph of mortgage rates since 1976:

Mortgage rates have been declining for 40 years, and are currently close to 3%. In a falling mortgage rate environment, buyers could refinance at lower rates - and that would mean already purchased houses would become more affordable over time (not included in this calculation)
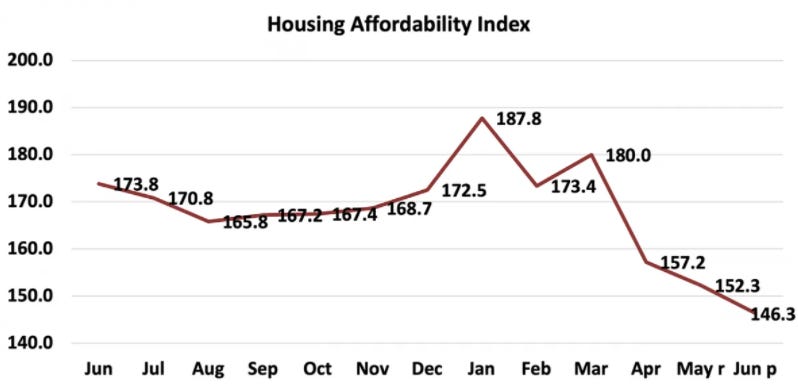
Photo credit: Michael Longmire on Unsplash