Boom, Bubble, and Bust
Look instead at the 1978 to 1982 period for lessons

By Capital Thinking • Issue #1071 • View online
It is natural to compare the current housing boom to the mid-00s housing bubble. The bubble and subsequent bust are part of our collective memories.
And graphs of nominal house prices and price-to-rent ratios look eerily similar to the housing bubble.
Housing: Don’t Compare the Current Housing Boom to the Bubble and Bust
CalculatedRisk by Bill McBride:
However, there are significant differences.
First, lending has been reasonably solid during the current boom, whereas in the mid-00s, underwriting standards were almost non-existent (“fog a mirror, get a loan”).
And demographics are much more favorable today than in the mid-00s.
Compare to the 1978 to 1982 period instead
A much more similar period to today is the late ‘70s and early ‘80s. House prices were increasing sharply.
Demographics were very favorable for homebuying as the baby boomers moved into the first-time homebuying age group (similar to the millennials now).
And inflation picked up from an already elevated level due to the second oil embargo in 1979, followed by the Iran-Iraq war in 1980, driving up costs.
In 1979, the Volcker Fed responded by raising rates, and combined with inflation, this pushed up mortgage rates sharply. Now the Powell Fed is embarking on a tightening cycle and mortgage rates have already increased significantly.
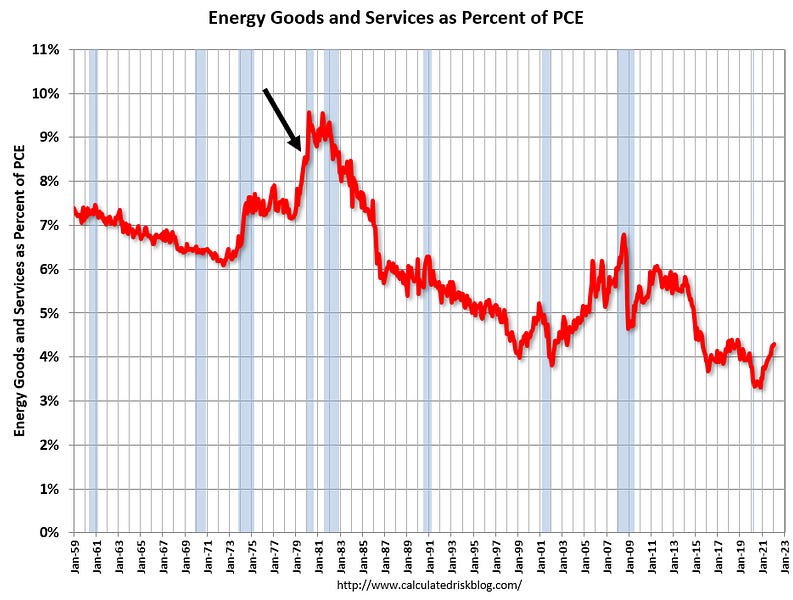
For review, here is a graph of expenditures on energy goods and services as a percent of total personal consumption expenditures through February 2022. The huge spikes in energy prices during the oil crisis of 1973 and 1979 are obvious (the black arrow points to the 1979 increase in prices).
Oil prices have increased sharply recently, but energy consumption is a smaller percentage of the overall economy now.

The second graph shows the year-over-year change in inflation since 1959. The black arrow points to the pickup in 1979.
Note that inflation was already elevated prior to the oil shock. This time inflation picked up due to the impact of the pandemic, and more recently due to the Russian invasion of Ukraine.

And here is a graph of mortgage rates from Freddie Mac. Freddie reported 30-year rates were at 4.67% in the last sample period.

Mortgage rates are still historically low; however, I think it is the change in mortgage rates that impacts the housing market. The next graph shows the year-over-year change in mortgage rates.

The recent year-over-year change in mortgage rates is about the same as during the late ‘70s period - even though overall mortgage rates are much lower than in the late ‘70s / early ‘80s.
What Happened to Housing in the 1979 to 1982 period?
Here is a graph of real house prices using the Case-Shiller National house price index. Real house prices peaked in 1979, and then declined about 11% over the next 3 years.
Note that in nominal terms, house prices increased slightly during that period, but the high inflation rate eroded the real value.
House prices tend to be sticky downwards in nominal terms. During the housing bust, it was the flood of distressed sales that led to cascading price declines, but that didn’t happen in the 1979 to 1982 period.